4. The exposure triangle
Table of contents
Photography comes with a lot of jargon terms and abbreviations. The main three terms used in photography are ISO, aperture, and shutter speed. All three affect the exposure of a photo, that is the amount of light that a camera has available to generate an image. A photo with too little light will be dark or unfocused, but too much light will result in an overexposed photo of un-focussed bright spots.
To illustrate the different components of photo exposure we will make comparison to this well exposed photo:
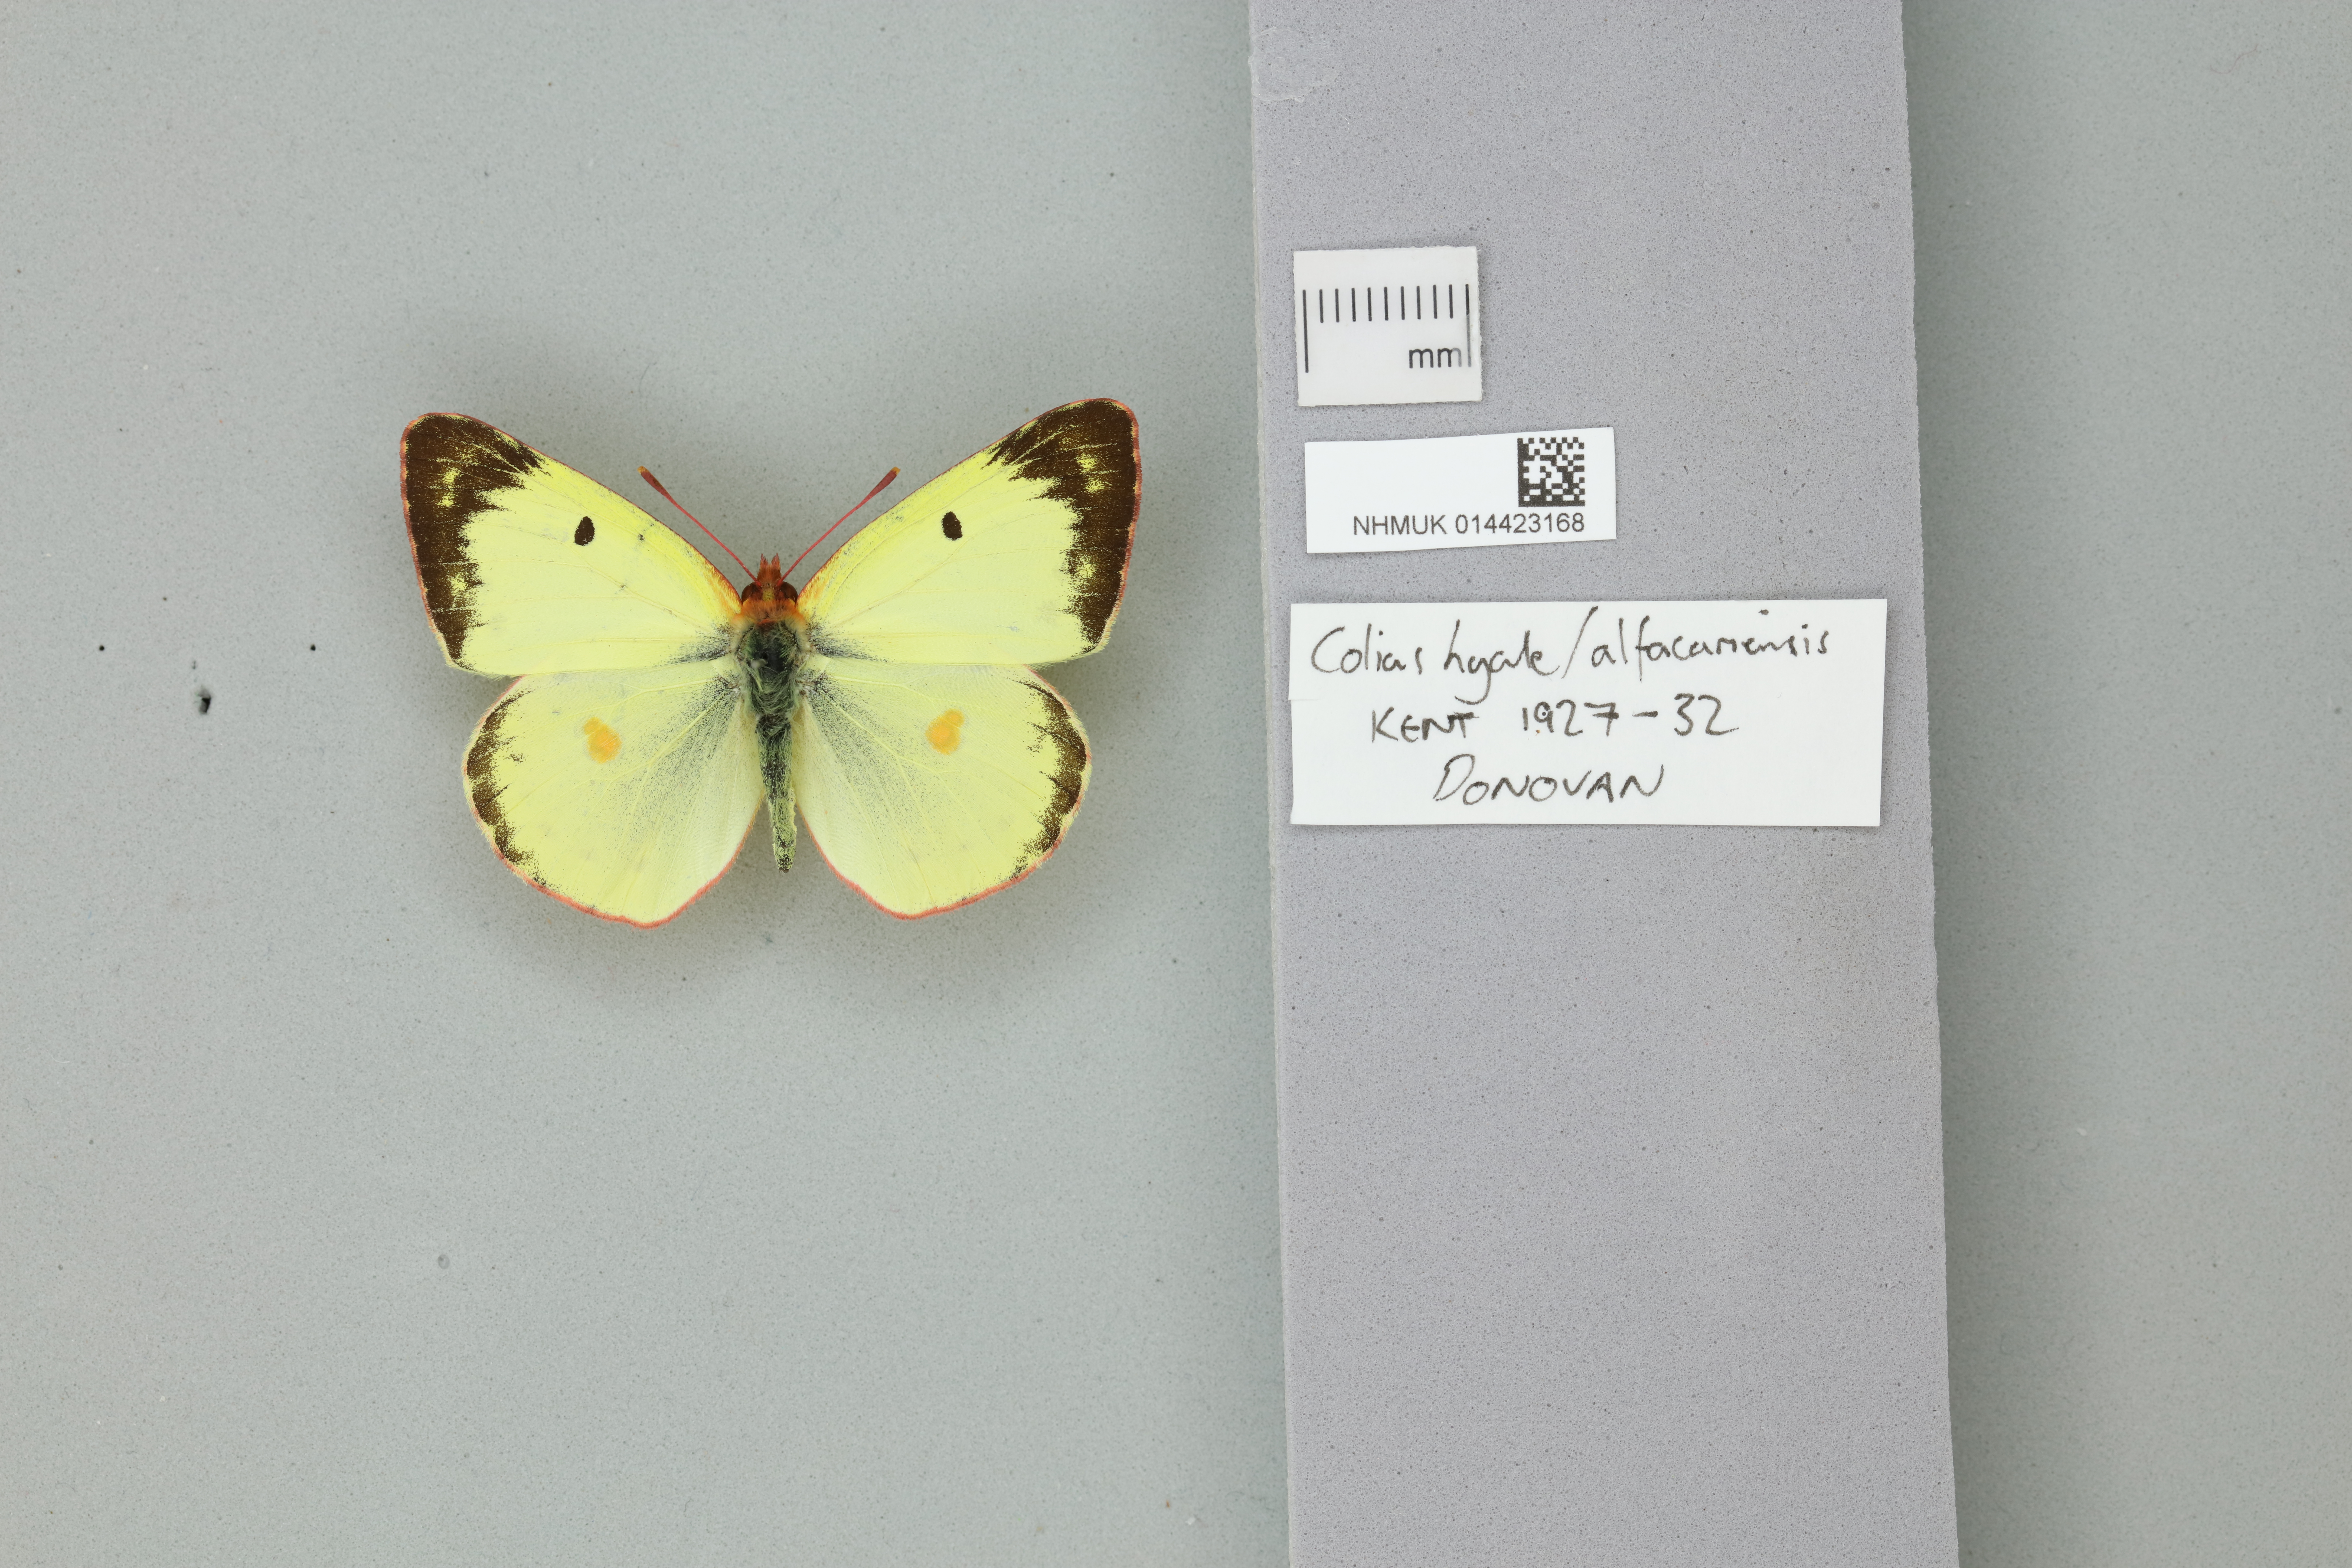
We will now explore how each of these three factors affects the images produced.
ISO
- Standing for ‘International Organization for Standardization’, ISO values typically range between 200 and 2000 and is a measure of the camera’s sensitivity to light. The higher the ISO the brighter a photo will be. Specimen imaging workflows use a range of ISO depending on the specimen and available lighting. For example, our herbarium sheet workflow uses a lower ISO value of 200 since additional light sources mean too high an ISO would produce an overexposed image. ISO stands for International Organization for Standardization. Unless you have a good reason not to, you should keep the ISO as low as possible. Increasing the ISO not only amplifies the image data (the signal) but also unwanted random data off the sensor (the noise). It is preferable to keep the signal-to-noise-ratio as low as possible.
Altering the ISO in our example photo from before, we can see the effect different ISO values have on the image.
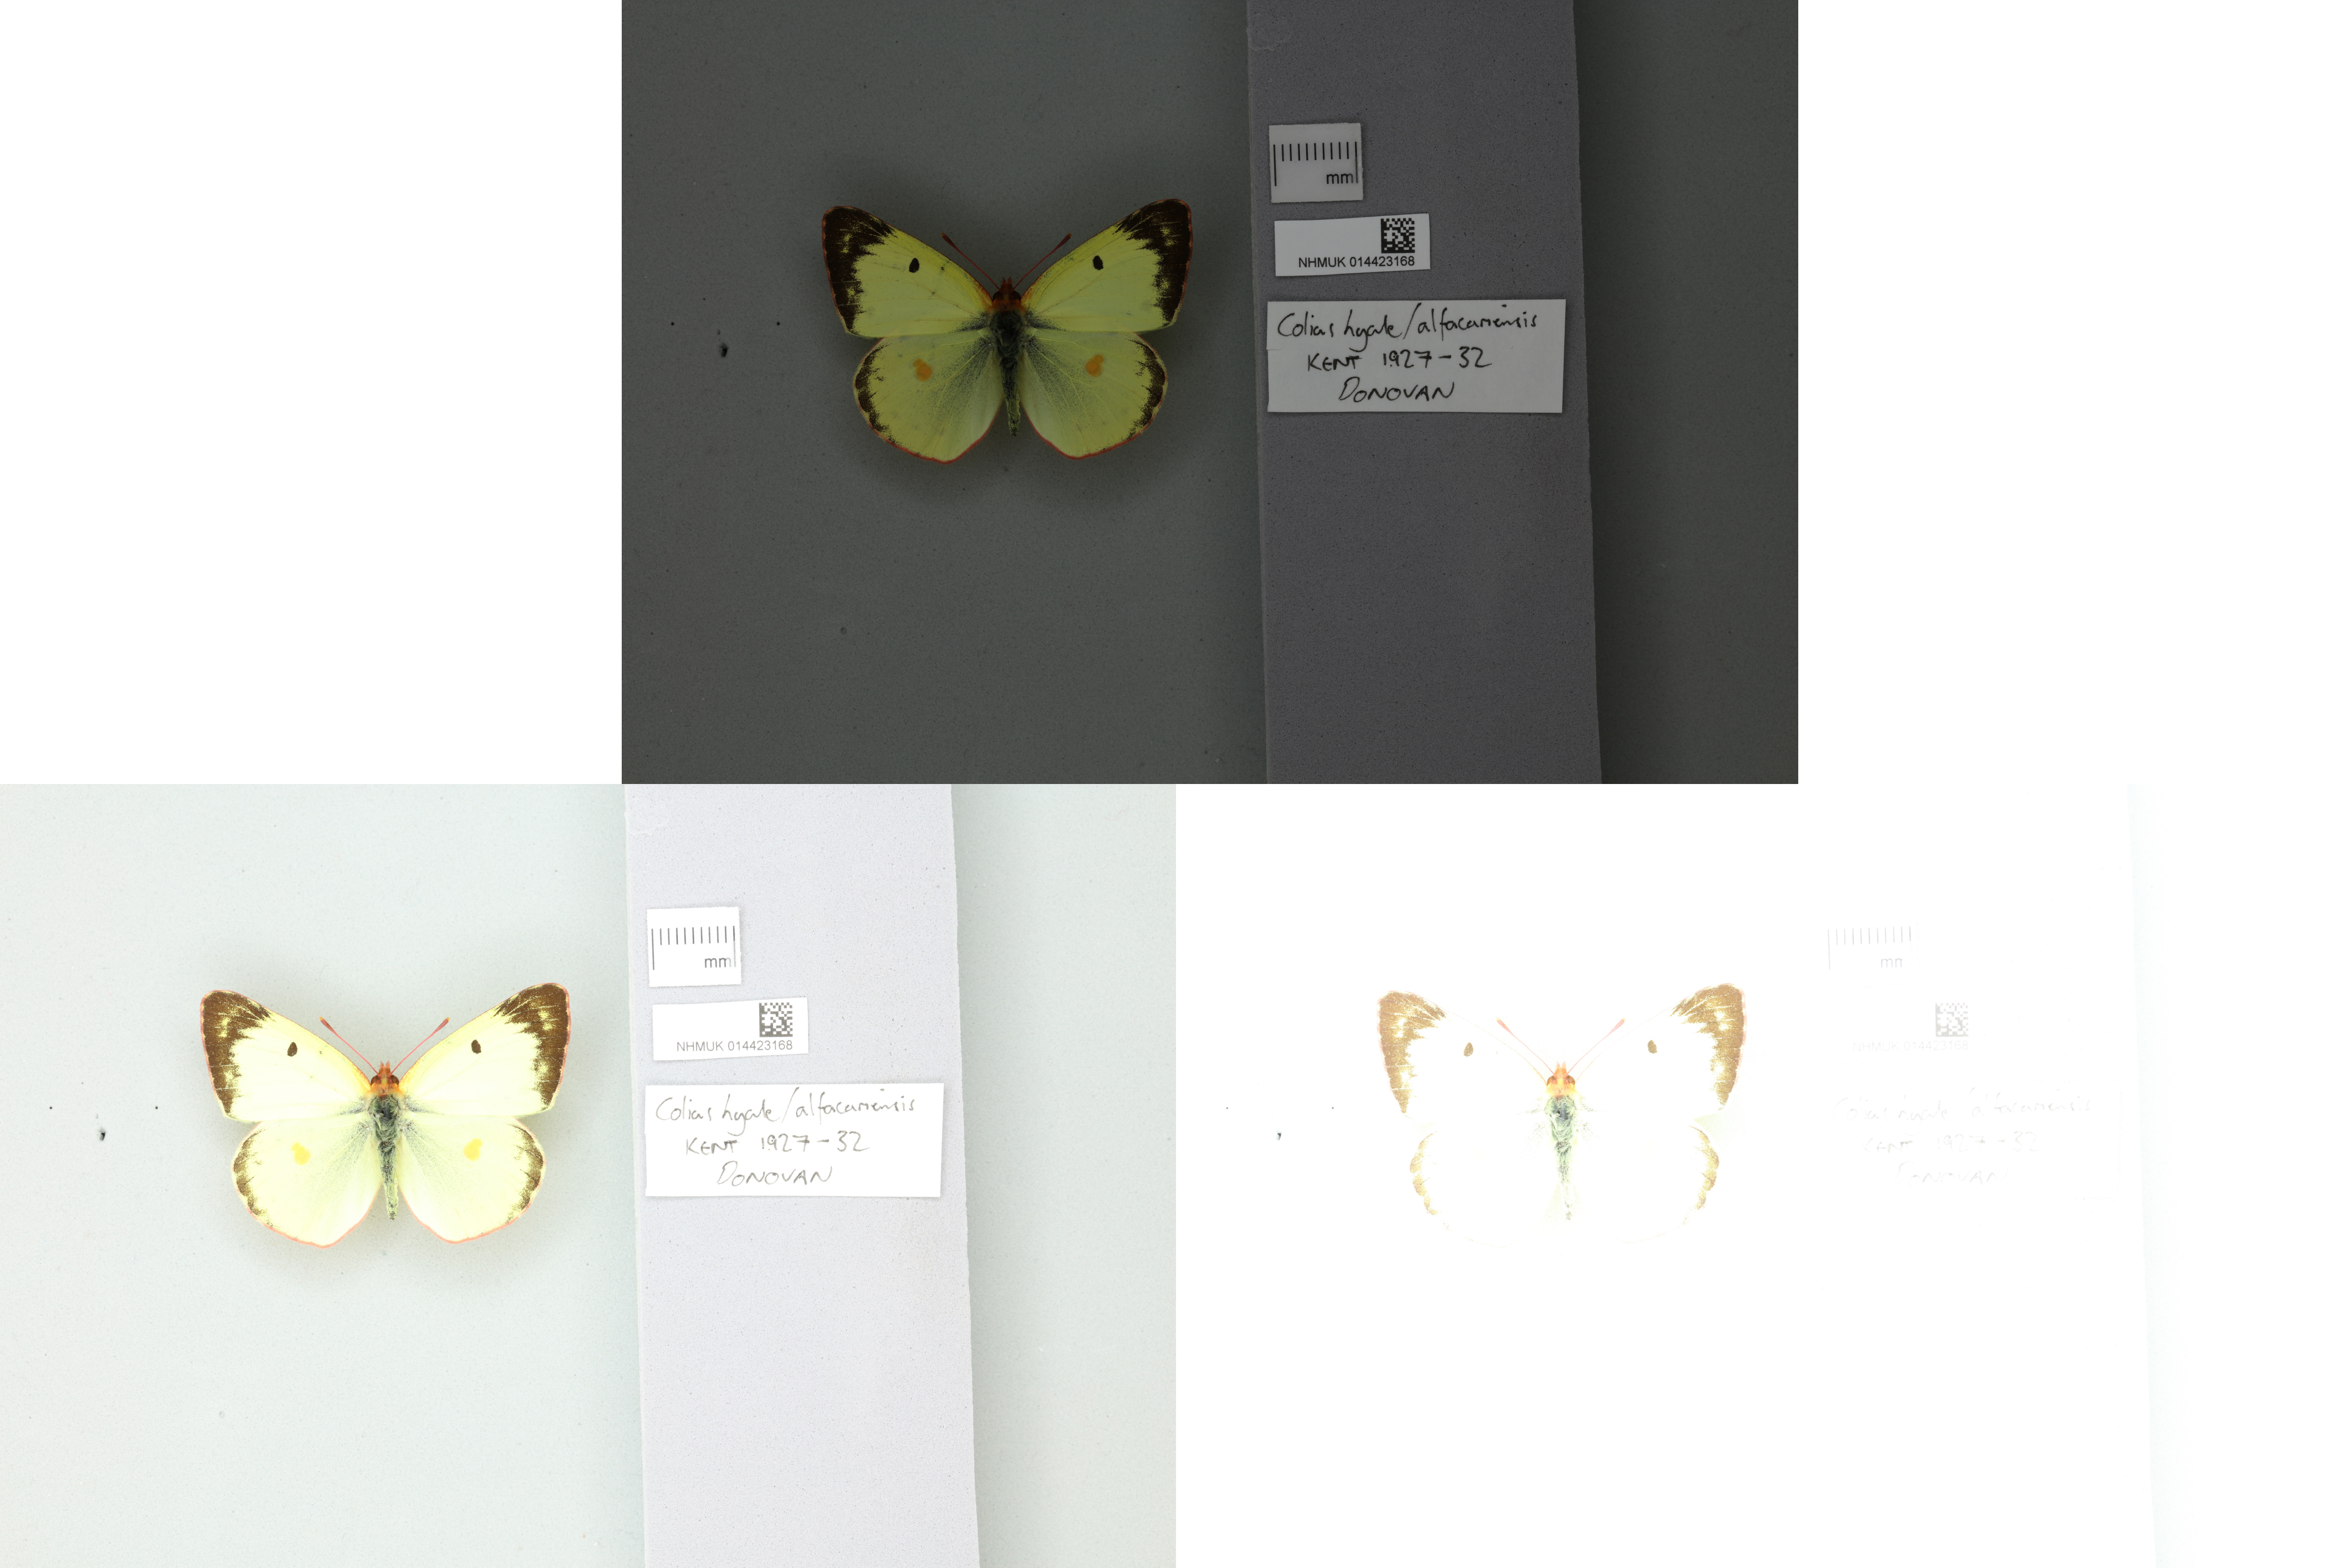 Figure 2: Same specimen as Figure 21, but with different ISO values applied. Starting with the top image and then left to right, the ISO in each image is: 100, 1000, 3200.
In each of these images the shutter speed and aperture are unchanged from the original photo (1/80, f/10), but with different ISO values. You’ll see that the higher the ISO the brighter the image is as the sensor is more sensitive to light that is coming into the camera.
Shutter speed
- How long the shutter of the camera is open, allowing light to enter the camera. The length of time the shutter is open controls the exposure of the shot. Shutter speed is measured by the length of time the shutter is open, usually in fractions of a second, e.g. 1/200, 1/100, 1/80 etc.
Look at these images of our example specimen which were taken with different shutter speeds.
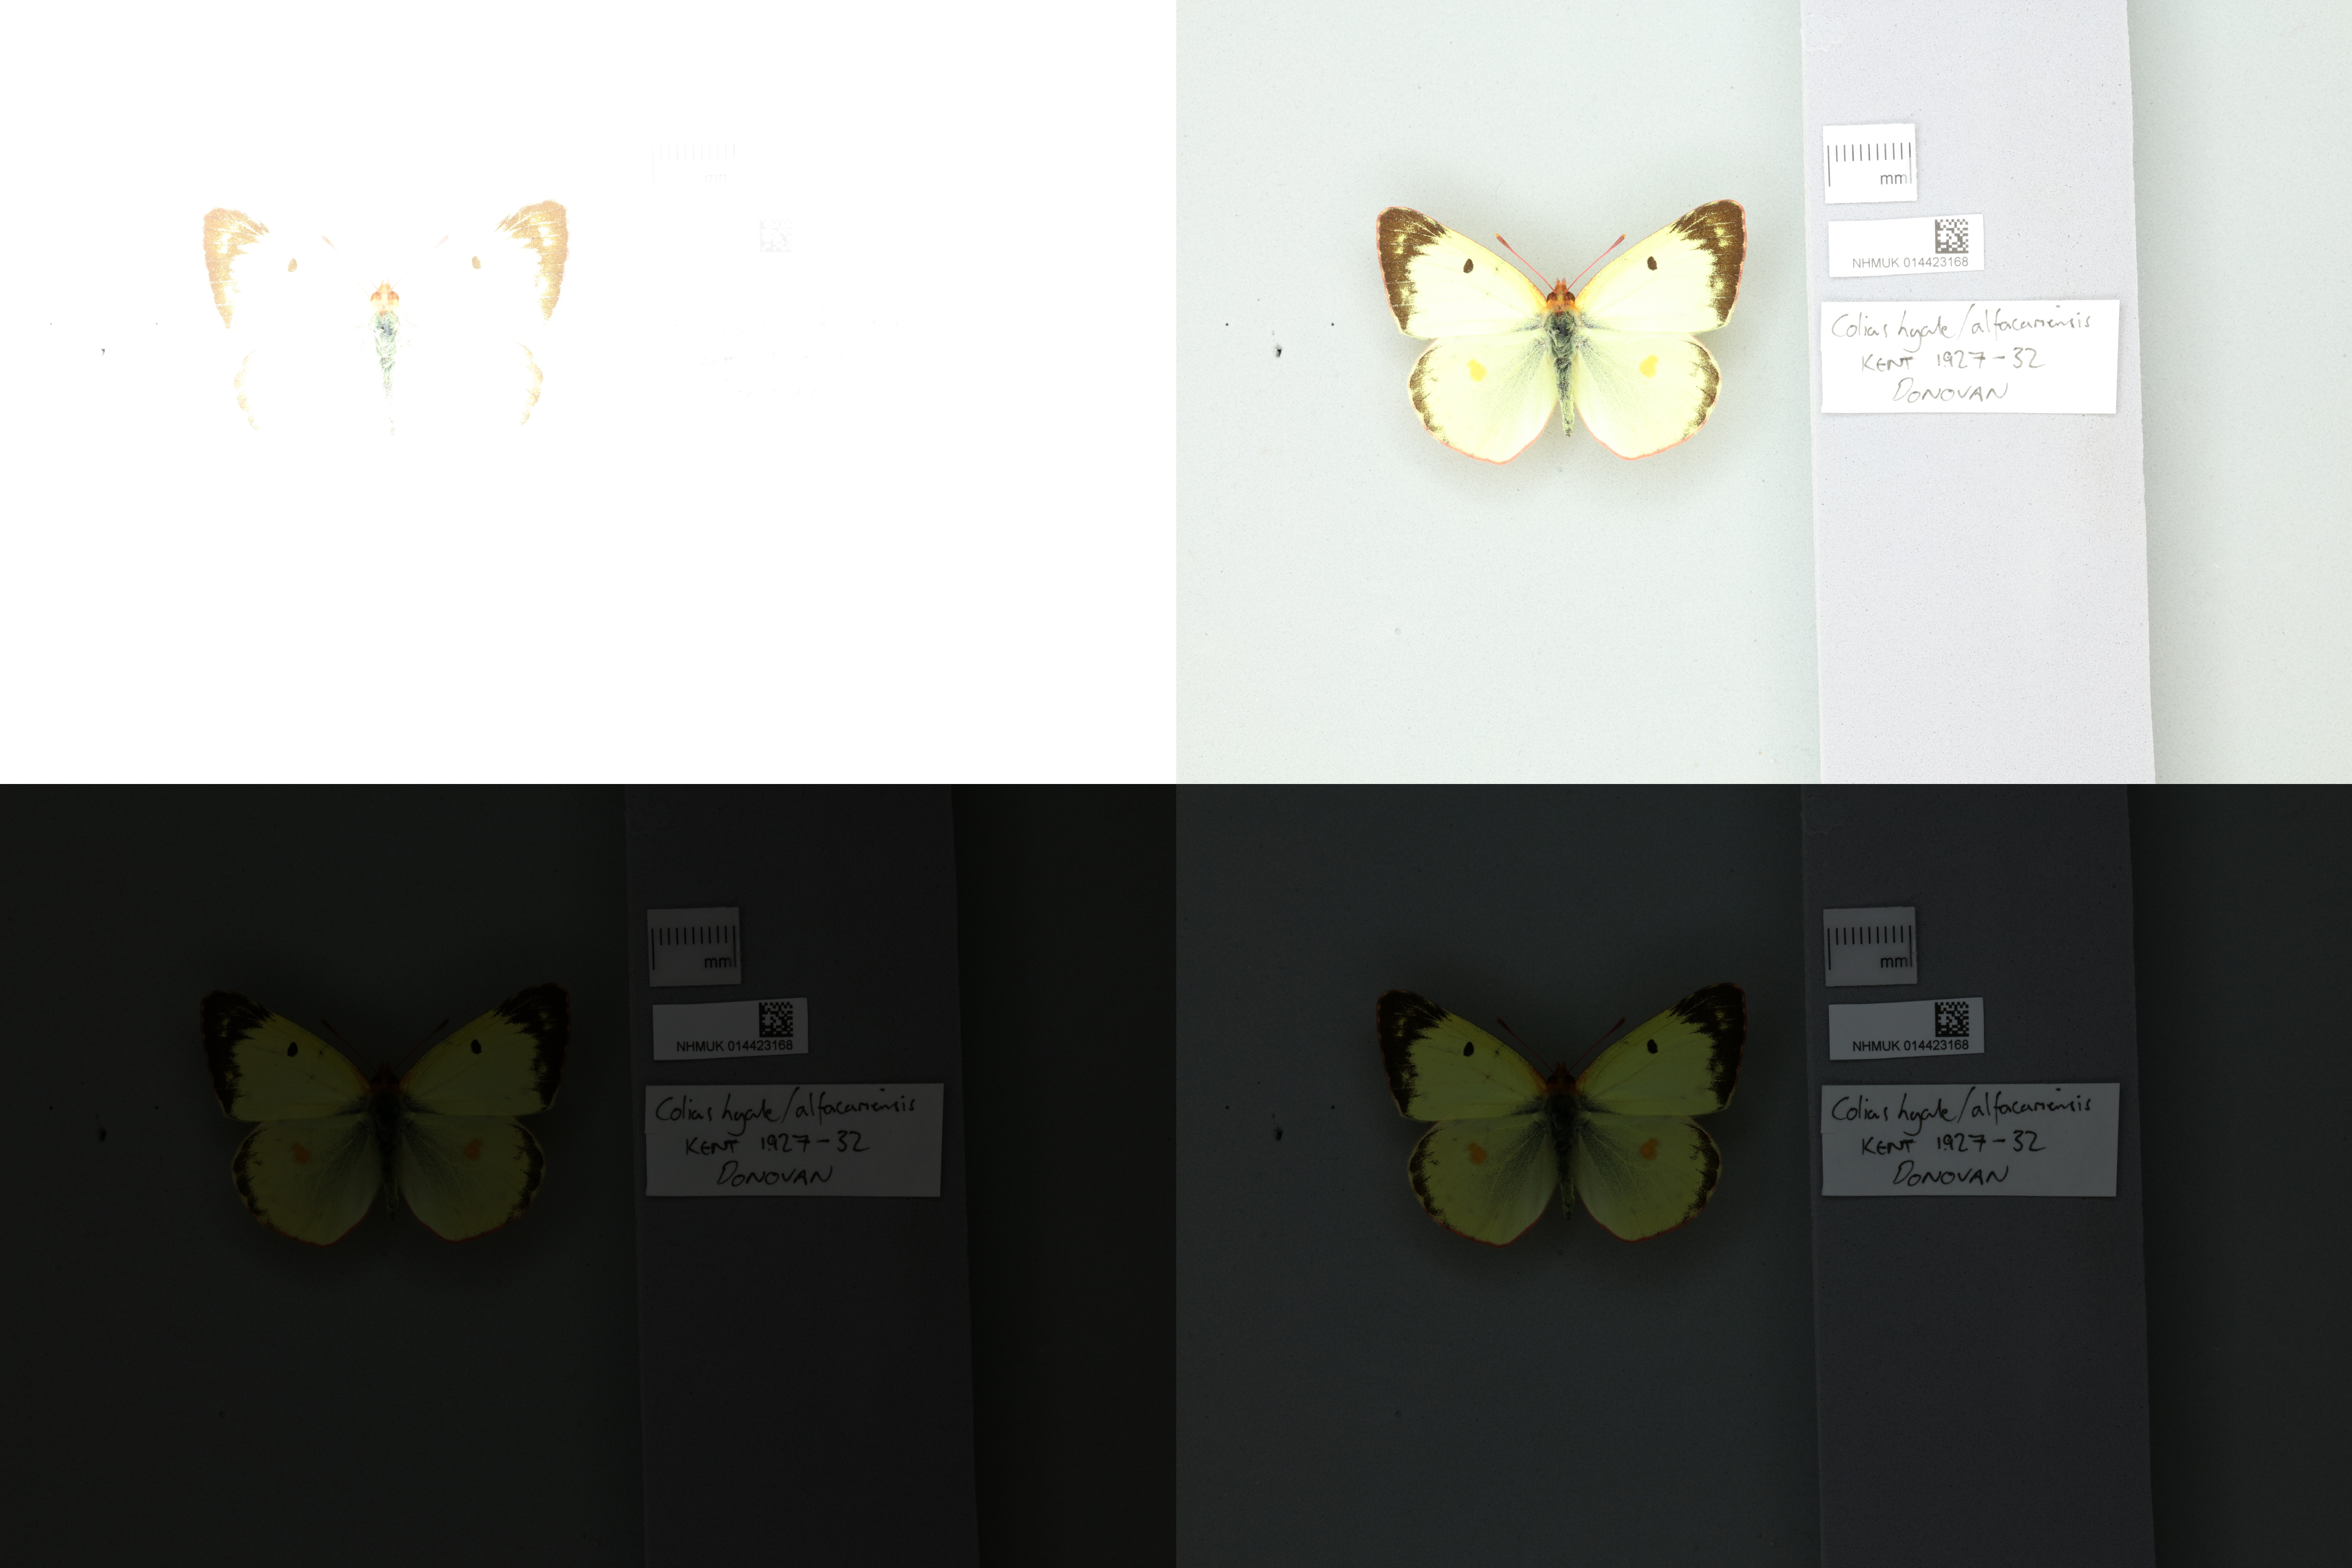 Figure 3: Same specimen as Figure 21, but with different shutter speeds used. Clockwise starting from the top left, the shutter speeds used were: 1/6, 1/30, 1/1600, 1/800.
Remember that shutter speeds are expressed in fractions of a second , meaning that an shutter speed of ⅙ mean s that the shutter is open for much longer than a shutter speed of 1/800. The longer the shutter is open, the more light falls on the sensor, creating a brighter image.
Aperture
- the size of the opening in the lens through which light passes. Controls how much and the area of light that enters. Aperture affects the depth of field of a photo (see below). Aperture is measured as a f-number, written as f/##. A smaller f-number, e.g. f/1.4, indicates a larger aperture, whereas a larger number, e.g. f/16, indicates a smaller aperture.
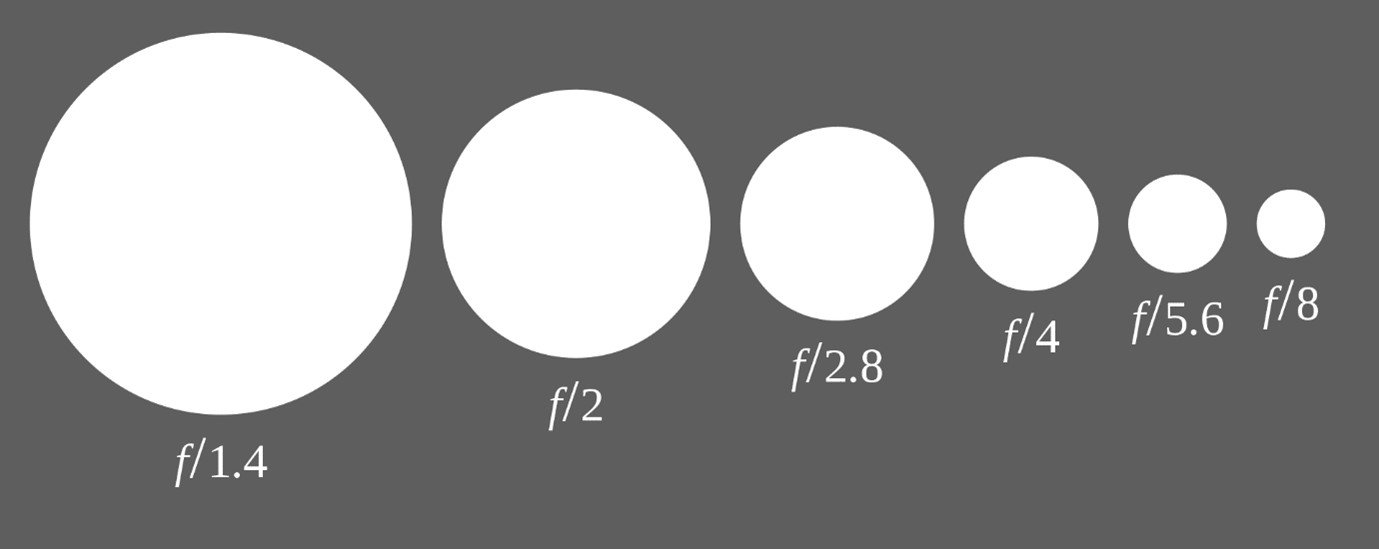 Figure 4: Range of relative aperture sizes with thier F/# notation. Wikimedia commons
Below we have a series of images taken with different aperture sizes.
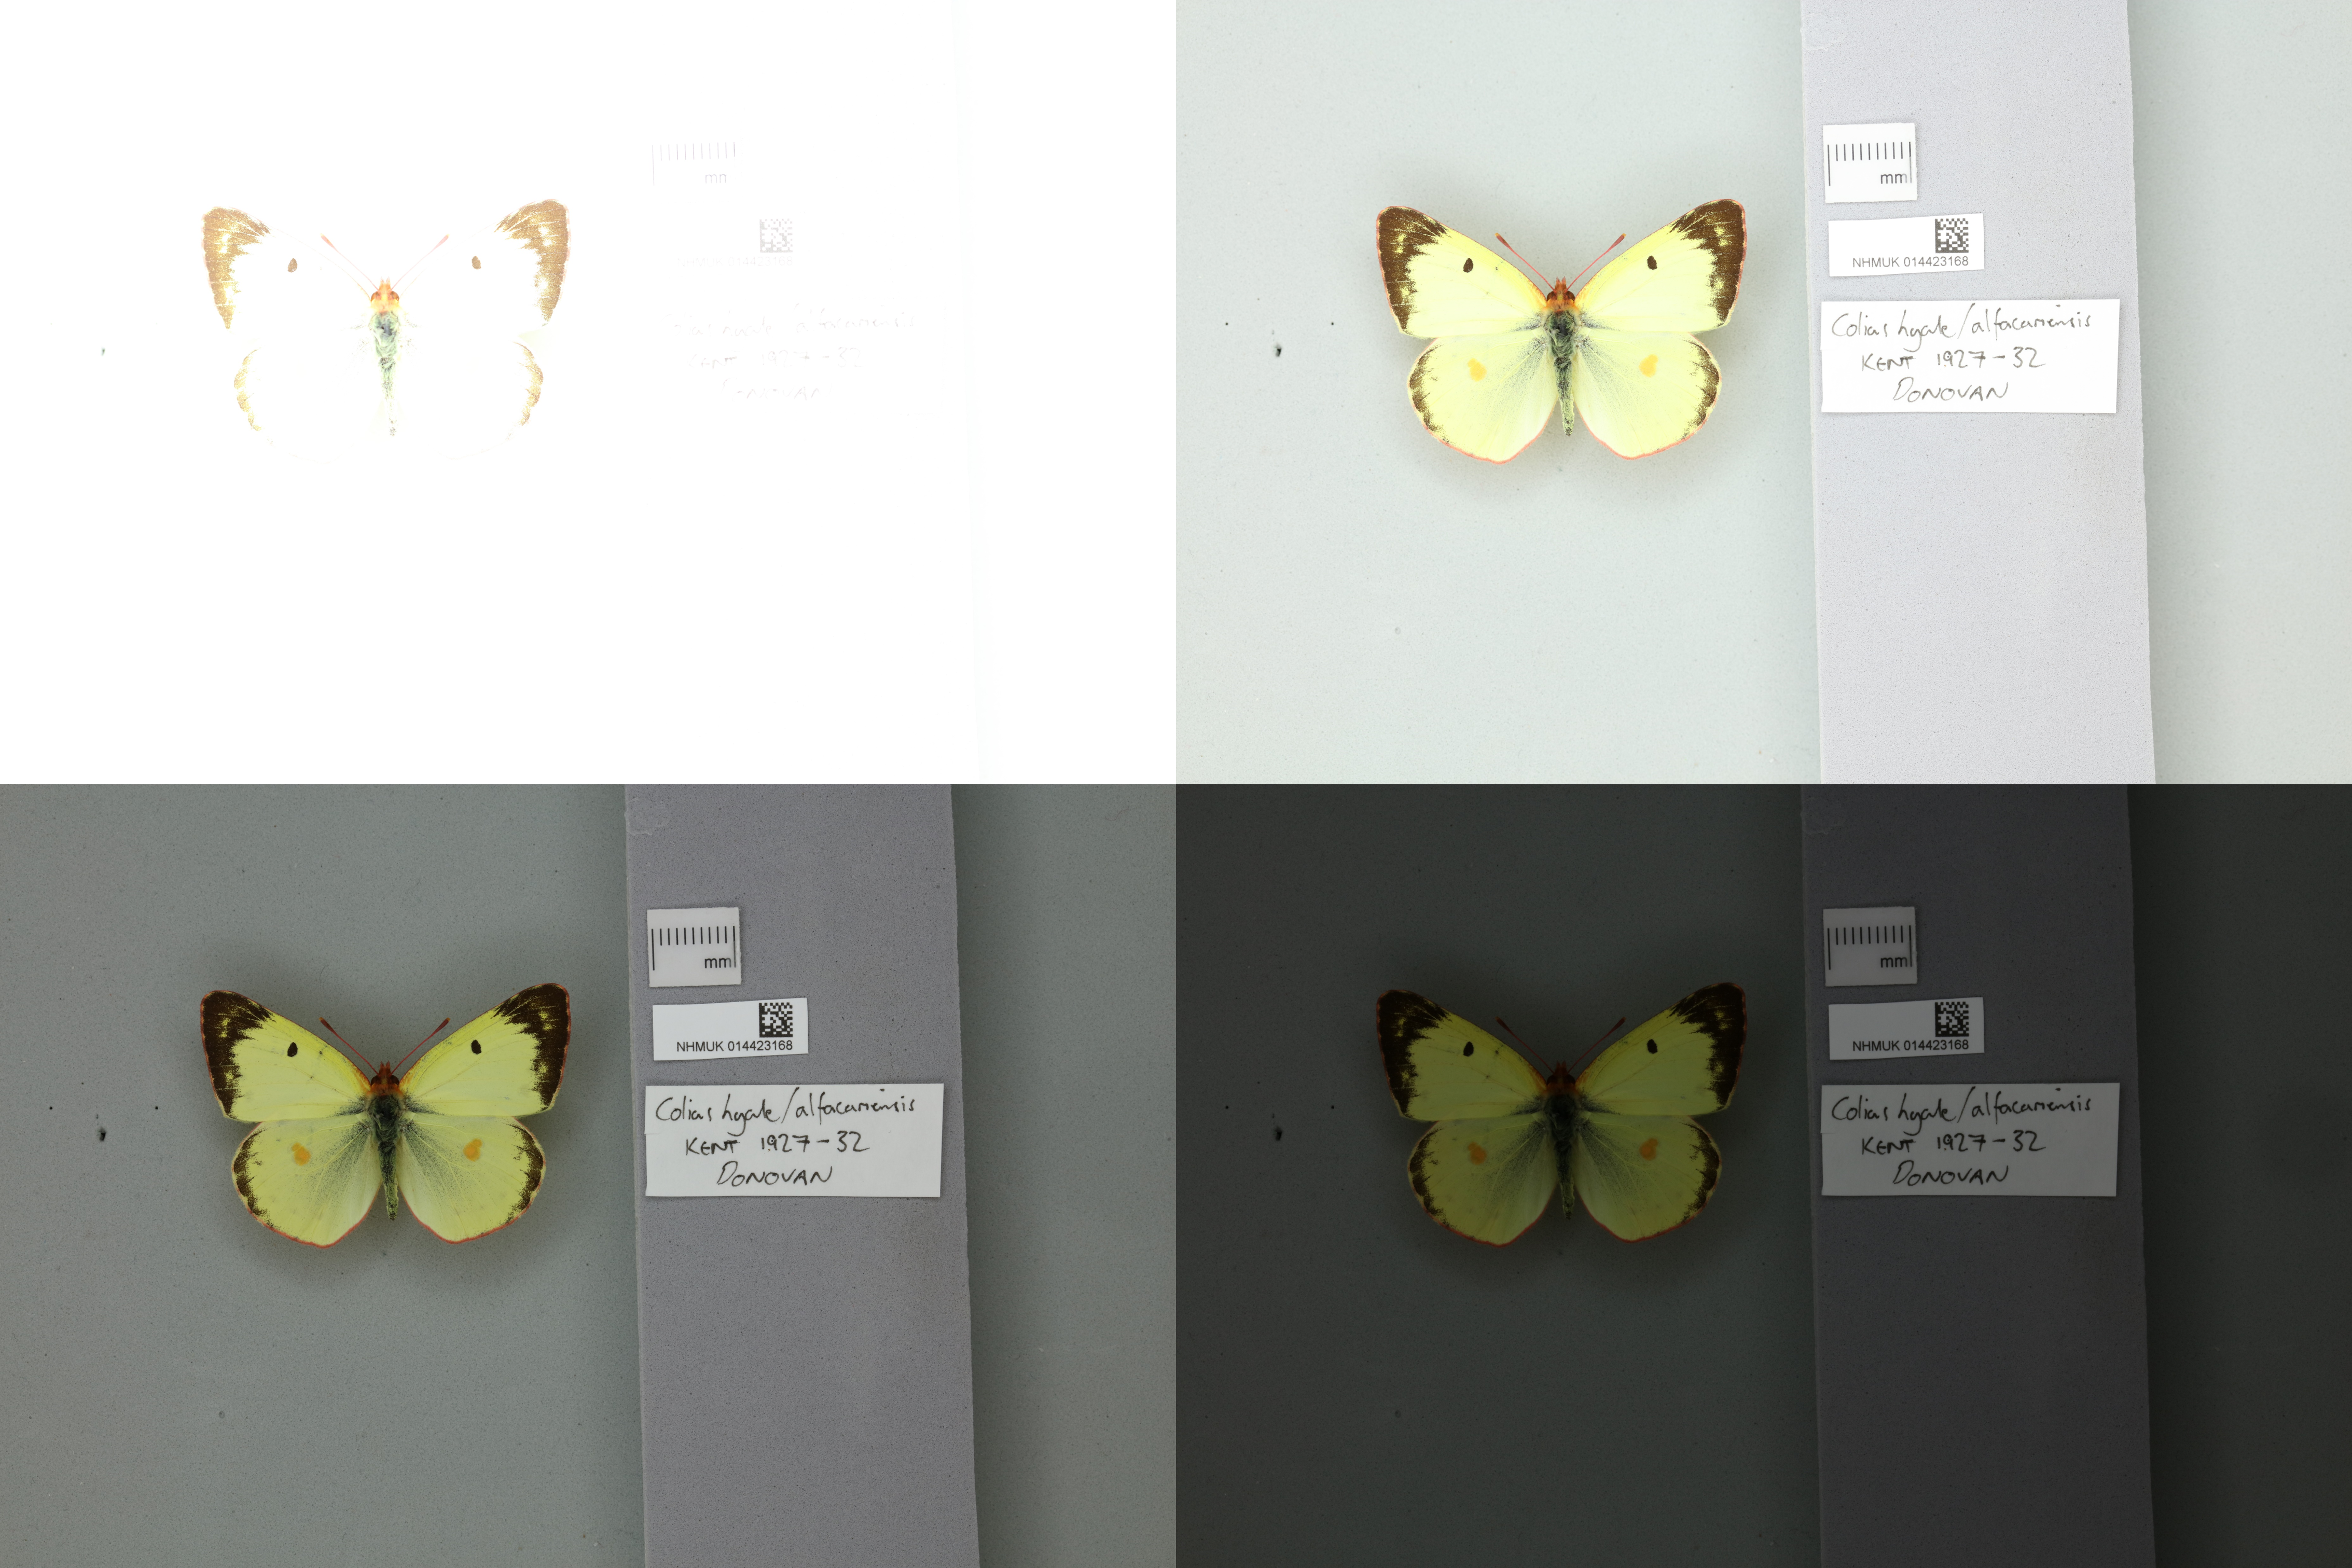 Figure 5: Same specimen as Figure 21, but with different apertures used. Clockwise from top left the aperture sizes are: f/3.2, f/7.1, f/14, and f/25.
We can see that the larger the aperture, the more light enters the camera and the brighter the image is.
Exposure triangle summary
The ISO, aperture, and shutter speed all affect the exposure (i.e. the amount of light) in different ways and need to be optimised and balanced to create a decent specimen image.
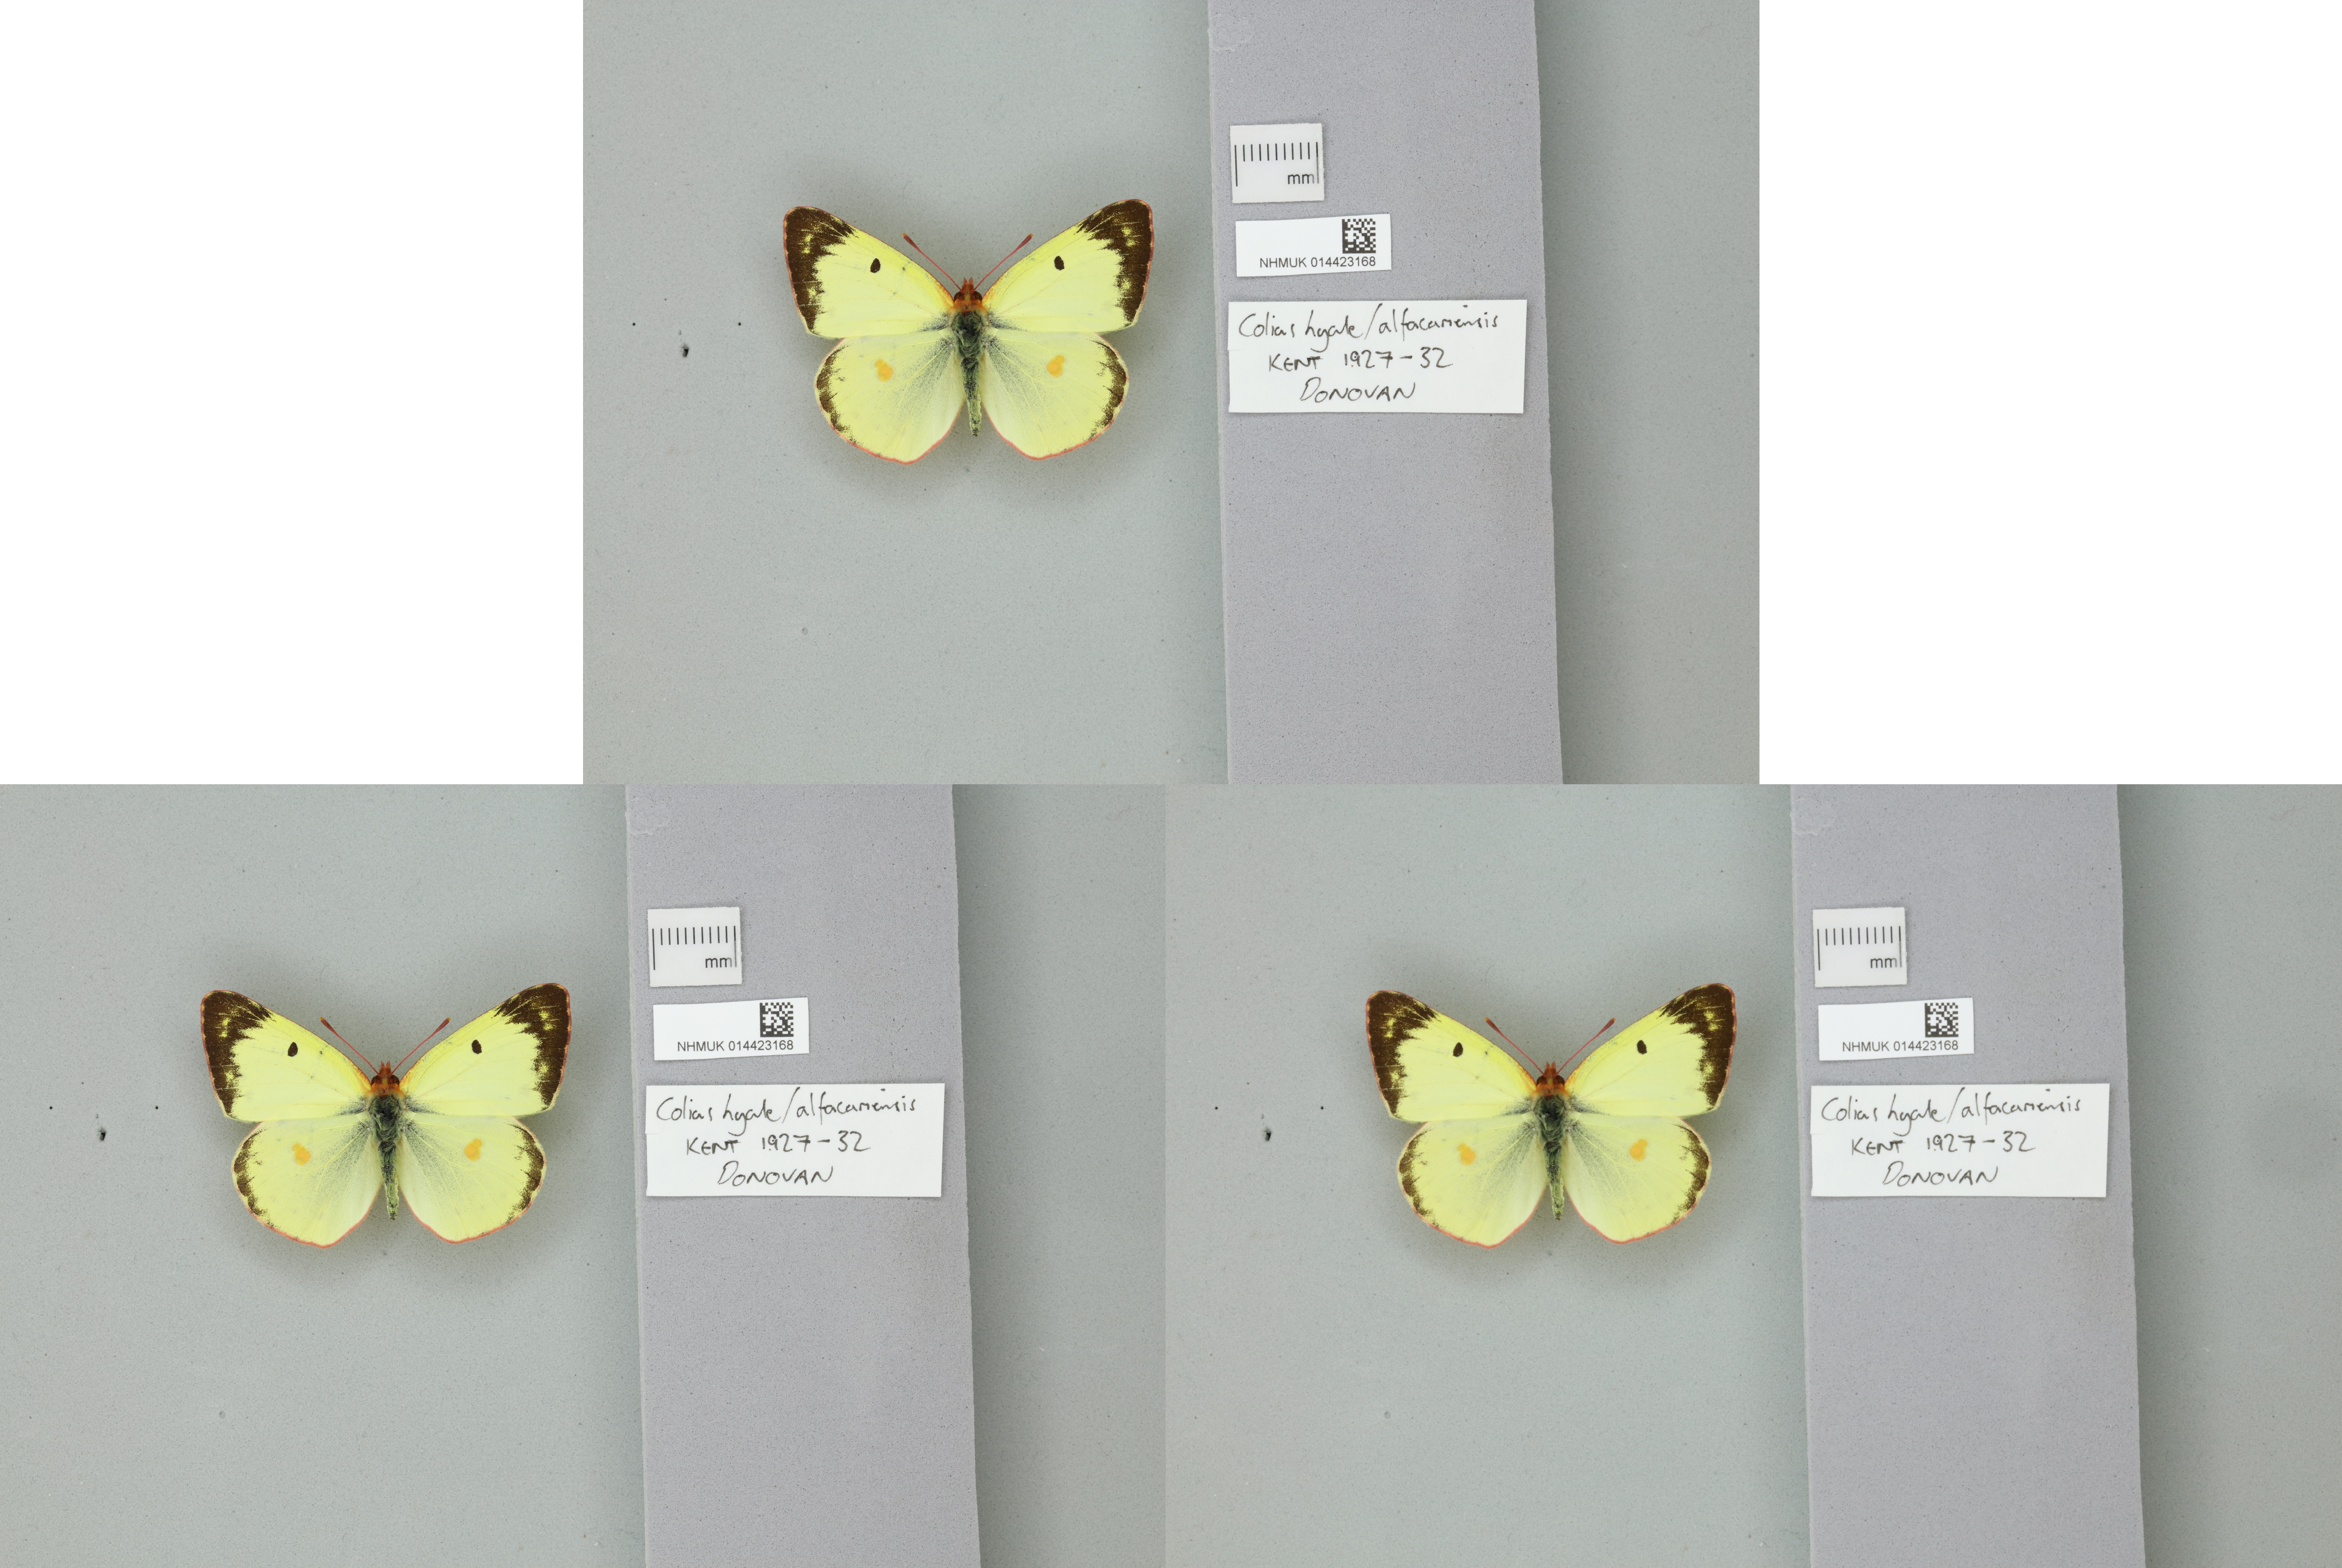 Figure 6: Three images of the Colias hyale specimen taken with different exposure settings. Despite the differe settings applied, the resultant images are almost the same as in each one the different settings are balanced. Top - 1/80 400, f/10; bottom left - 1/10, 100, f/14; bottom right - 1/50, 1600, f/25.
The different camera settings can be confusing to get your head around. The following figure should help with this and summarises the effect of each factor. However, following the specifications in established workflows will hopefully prevent you from taking under or over exposed photos.
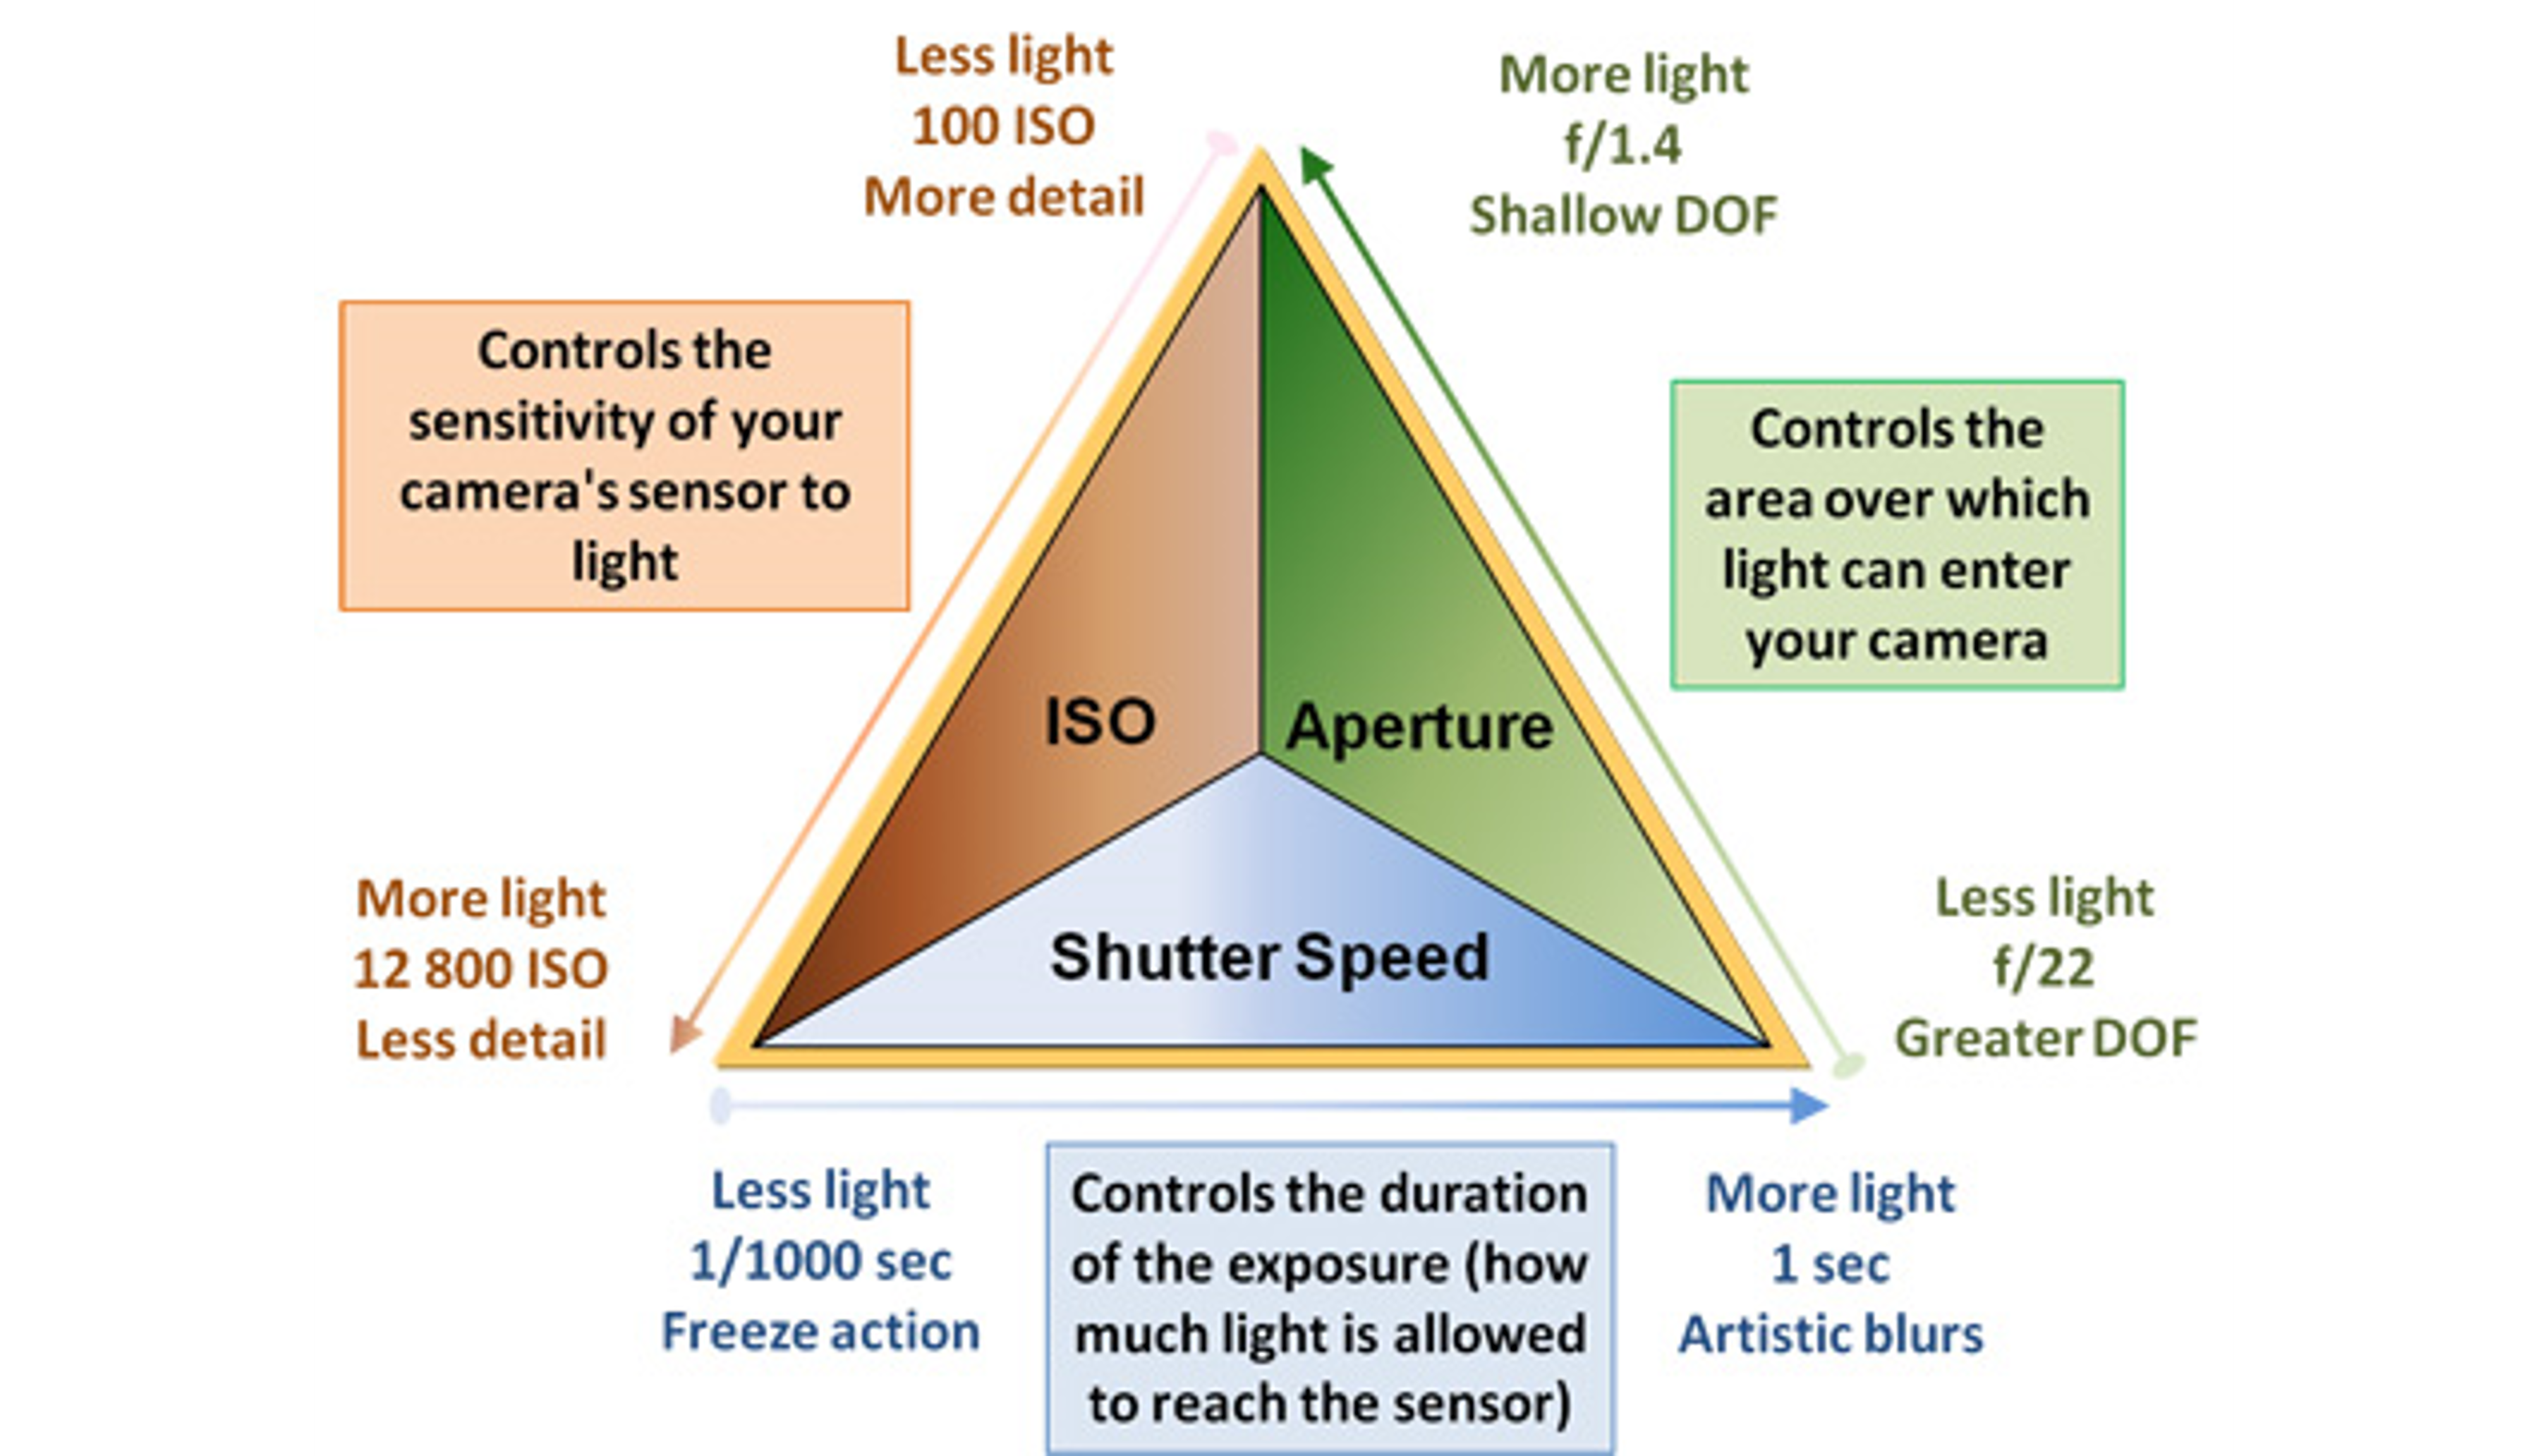 Figure 7: Representation of the exposure triangle of ISO, shutter speed, and aperture. For a different approach to explaining exposure check out his video.
Depth of field
An additional consideration when photographing 3D specimens is depth of field - the distance between the lens and parts of an object that are in focus. Depth of field is determined by the camera’s aperture setting (see glossary), lens focal length, and the distance to the subject.
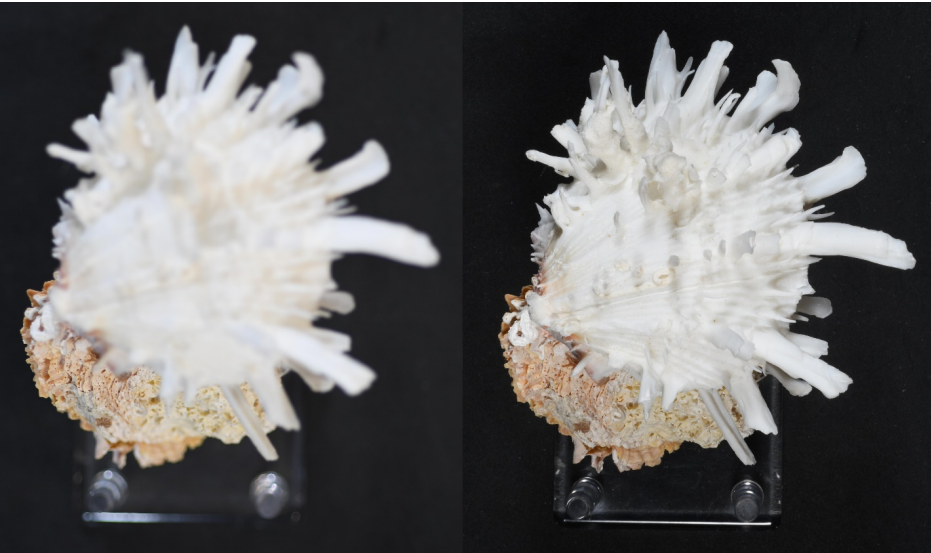
Both pictures are taken of the same specimen using the same camera but using different apertures (left, f3.2; right, f32). The smaller aperture creates better contrast and clarity in the image but also required seven times as much light.
Increase depth of field
- Narrow your aperture (larger f-number)
- Move farther from the subject (less in frame)
- Shorten focal length (zoom, or change prime)
Decrease depth of field - Widen your aperture (smaller f-number)
- Move closer to the subject (more in frame)
- Lengthen your focal length\
It is tempting to think that all that needs to be done is to “stop down” the lens to its narrowest aperture (often f/32) but beyond a certain point whilst you will gain depth of field, the overall resolution of the image will be limited by diffraction. Lenses are usually sharpest closed down around three stops from the maximum aperture. f/16 is often given as an ideal aperture for scientific work.
While the aperture can be altered to optimise the depth of view, some specimens will simply have too great a 3D size to be captured the specimen in focus in a single photo.
For example, consider these two phtoos below:
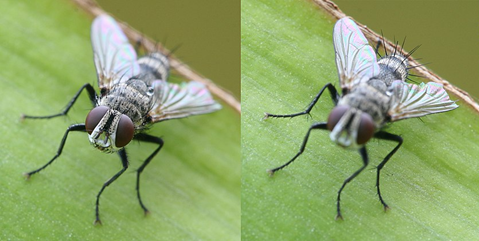
Figure 9: same image different dpeths of fieldthe photos below are shot with the same depth of field but focused over different distances. In the left photo the fly’s head is in focus, but not its abdomen. The right photo the abdomen is in focus, but not its head. Taken by Muhammad Mahdi Karim - Wikimedia commons.
In some cases, such as this, the issue of depth of view on 3D-objects can be resolved by image stacking:
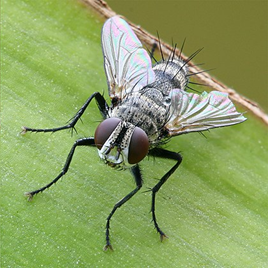
Figure 10: same image as Figure 7 but with images stacked. The whole fo the fly’s body is now in focus. Taken and produced by Muhammad Mahdi Karim - Wikimedia commons.
Depth of field is a highly complex factor to control. If you are interested check out this very thorough account of depth of field
Next page: 5. Image files