Digitisation Monitoring
Table of contents
- Overview
- Monitoring Digitisation Rates
- Natural History Museum London: Monitoring Digitisation Rates
- Museum für Naturkunde Berlin: Monitoring in Two Collection Digitisation Processes
- Royal Botanic Garden Edinburgh: Monitoring Digitisation Rates
- João de Carvalho e Vasconcellos Herbarium (LISI), University of Lisbon: Monitoring Digitisation Rates
- Monitoring Processes for KPI and Downstream Monitoring
- Authors
- References
- Licence
- Document Control
Overview
Digitisation monitoring allows you to measure the performance of processes, helping you to deliver project objectives on time and on budget. Project monitoring and control are part of project management and run in parallel to the execution phase in a project life cycle.
Establishing a process for monitoring, in particular for measuring digitisation rates, is a very useful tool for managing digitisation projects. In addition, those statistics can and should be used for promoting and monitoring the performance of larger units, such as departments or institutions.
Monitoring Digitisation Rates
The main objective of monitoring digitisation rates is to identify potential issues of the project design, which become apparent or relevant during the execution phase. In order to interpret digitisation rates correctly it is crucial to specify the expected performance rates before project start, ideally by allowing an appropriate time for workflow testing.
Based on the results of a testing phase and based on the specified performance rates it will be possible to refine the project objectives, to calculate the costs and to specify the targets for the digitisation staff. During the execution phase, information derived from monitoring may generally help to improve digitisation projects on the level of work organisation, of staff skills and of technology.
-
Monitoring identifies elements of digitisation workflow needing improving. For a stable and consistent digitisation rate it is important that the individual steps of a workflow run at the same speed. Workflows may involve curatorial tasks to prepare objects for digitisation, metadata capture, imaging, transcription, database integration, publishing of assets and many more. Those tasks may involve different people and technologies, which may lead to high complexities and interdependencies. Monitoring helps to prevent backlog and to assure that operators have sufficient objects available to work continuously.
-
Training requirements become apparent, leading to the development of skills of the staff involved. Stable digitisation rates do not only require a good workflow design, but also operators need to have the right skills to fulfil the assigned tasks . Training is a key to success, especially if projects run over a long time or involve many people (e.g. volunteers or student helpers).
-
During the execution phase of a digitisation project technical improvements are less likely, because they may lead to inconsistencies in quality of the digital product. However, especially software improvements may speed up digitisation processes considerably. Also additional computing resources may lead to an overall improvement of the digitisation rates.
Monitoring processes can reveal potential issues in the project and workflow design. The following table enumerates a number of factors that influence digitisation rates and possible solutions to react.
Table: Factors that influence digitisation rates
| Influence | Possible solution |
|---|---|
| Size of collection | Assess the number of objects to be digitised accurately |
| Operator’s experience level and familiarity with equipment and its setup | Use a competency framework to determine the required skills and train accordingly |
| Granularity of available database information (e.g. groups of specimens recently reviewed require fewer effort to update) | Assess the depth of available database information and define the objective of metadata acquisition before starting the project |
| Frequency of ‘new record’ operations, which are more time-consuming then ‘minimal data checking’ operations | Assess the depth of available database information and define the objective of metadata acquisition before starting the project |
| Efficiency of the technological setup image station acquisition speed (e.g. flatbed scanners are much slower then planetary scanners) | Measure efficiency and make improvements before starting the project. Hardware changes should be avoided during the project |
| Handwritten labels readability is an important factor for transcription tasks | Make sure to have the necessary skills in the team to read a wide spectrum of handwritings. If transcription is based on digital images, make sure that smallest relevant detail is resolved (usually > 400ppi) |
| The need for ‘resting breaks’ from the operator, since the tasks performed demand a high level of concentration, which is hard to maintain over long period | Establish a performance rate before the start of a project and allow up to an extra 20% of time effort for the execution phase in comparison to the testing phase |
| Acquisition of as much information as possible | It is impossible to acquire all information. To avoid fluctuations in information depth, make sure that all stakeholders agree on the outcome of the digitisation process (whole pipeline from pre-digitisation curation until data delivery and publication) before starting the project |
We have included case studies below from institutions describing methods and workflows for process and database monitoring. These case studies apply primarily to digitisation rates i.e. the number of objects processed in a given time frame, which allows the institution to measure performance. The University of Lisbon case study also includes a monitoring step for data preparation.
Natural History Museum London: Monitoring Digitisation Rates
Click here to expand
Understanding digitisation rates is an essential element to our digitisation project management approach at the NHM. Each day, our digitisers record in a shared spreadsheet the number of specimens they have imaged, the number of database records created and the number of specimens transcribed. Each digitiser also includes the number of minutes spent on these tasks, which allows us to calculate the average time to digitise each specimen.
To monitor our digitisation rates, we use calculations from the Program Evaluation and Review Technique (PERT). For each digitisation project, the minimum (a), maximum (b) and median (m) rates per person per hour are calculated. This is used to calculate a base performance rate (a + 4m + b/6) and standard deviation ((a-b) / 6).
These figures are used to schedule our digitisation projects. We take the base performance rates, alongside an estimate of specimens to be digitised in a particular project, and forecast how many person hours it will take to complete each project with additional contingency built in should estimates be found to be overly conservative. This forecast is particularly helpful if we have a project deadline coming up, as we can use this information to assign enough digitisers to ensure the specimens are digitised on time.
We monitor our digitisation rates for each project on a monthly and quarterly basis, comparing our forecasts to the actual rate. We can then adjust resources if our rates are higher or lower than expected. It also helps us to schedule new digitisation projects, as we have an estimate of when current projects will finish.
Museum für Naturkunde Berlin: Monitoring in Two Collection Digitisation Processes
Click here to expand
As part of the ongoing construction work, the historical bird hall of the MfN Berlin is being emptied. The hall contains approximately 11,000 mounted specimens, ranging from hummingbirds to ostriches. The process includes cleaning, repairing and labelling of the objects, followed by imaging and packing in transportation boxes. As the individual process steps require different amounts of time and expertise, the process runs asynchronously. After cleaning, specimens are temporarily stored and then collected by the digitisation team. After the imaging process, the specimens are temporarily stored again before being packed into transportation boxes. The imaging process takes place once a week and is dependent on the rate of cleaning and restoration. Therefore, the amount of birds being digitised greatly varies (between 16 and 276), with an average of 145 per week.
The start of the renovation work in the hall is scheduled and sets the deadline for the removal of the collection objects. Weekly statistics are collected to monitor the progress of the project. The digitisation step is most suitable for this, as it produces easily countable digital data. Images are being named with the specimen collection number and are stored in a daily folder. After checking the quality of the images as well as the accuracy of the file names, images are being sorted into taxonomic groups. A checklist for reference is being provided by collection management for each taxonomic group. For process monitoring, the number of processed specimens is relevant. It is irrelevant how many images are created during digitisation or how much time is required for processing individual preparations. The aim of the monitoring is merely to keep track of regular progress with regard to the deadline for emptying out the room.
The malacological collection of the Museum für Naturkunde Berlin comprises approximately 7 million individuals in 250,000 lots. Those lots will be digitized over the course of the next 4 years by transferring the collection data into a database and taking object images. The digital recording of the collection data is limited to the core elements taxon, collection number, type status and locality. If no catalogue number exists one will be assigned during this step. Data acquisition is done via a specially developed software that enables interoperability with the digitisation system. Since both process steps function completely independently of each other, monitoring is also carried out independently. Operators report the amount of processed objects (inventorized and photographed) into a spreadsheet on a weekly basis.
It is important to jointly agree on project goals, i.e. units to be processed in a certain time. Therefore various test phases were carried out in which operators and managers could determine the realistically achievable throughput. Project monitoring aims at identifying problems at an early stage in the step up of a new workflow. However, due to staff availability, strong daily fluctuations may be observed in the throughput rates. Thus, small-scale monitoring on a daily basis may easily lead to overreactions by project controlling. The digitisation process in the mollusc collection is therefore monitored on a monthly basis, which is sufficient to identify potential workflow disturbances and to level out daily fluctuations.
As mentioned above, the process includes two independent steps that are also monitored independently by the project management. At the moment, however, only the digitisation statistics are reported to the upper project management. The reason for this is that the same specimens are being handled and monitored twice, for databasing (inventorization) and imaging (photographing). At the MfN, all monitoring results from digitisation processes are aggregated to a database in order to observe the progress of the collection discovery and development project. This includes the removal of the mounted bird preparations and the digitisation of the mollusc collection among others. Including the same specimen twice in those statistics would suggest a much faster and unrealistic progress.
Royal Botanic Garden Edinburgh: Monitoring Digitisation Rates
Click here to expand
During the life of the Herbarium digitisation programme, digitisation rates have changed significantly through changes in level of digitisation, equipment upgrades and software development. The mass digitisation programme currently uses bespoke software for data capture and image processing, allowing a more automated workflow. We have recently migrated to a new Herbarium collection management system (Specify) for which a rapid data entry application has been developed by an external contractor. We have also installed new imaging equipment with custom-built lightboxes and adjustable desks. We are now in the process of assessing the impact of these improvements on the digitisation rates.
Databasing rates are calculated by querying the Herbarium specimens database (Specify). This allows us to get both weekly and monthly rates for each digitiser based on the timestamp of the records they have created.
Imaging rates are calculated by querying the imaging database (in house). As with the databasing rates this allows us to record both weekly and monthly rates for each digitiser.
We currently transfer the weekly rates for imaging and databasing into an excel spreadsheet and use conditional formatting to help us visualise whether each digitiser is meeting a weekly target for databasing and imaging.
João de Carvalho e Vasconcellos Herbarium (LISI), University of Lisbon: Monitoring Digitisation Rates
Click here to expand
The «João de Carvalho e Vasconcellos» Herbarium (LISI), from University of Lisbon, is a small university herbarium (about 80.000 specimens) within its School of Agriculture (Instituto Superior de Agronomia), primarily aimed to support research and education. The team involved in the digitisation operations described in this section is restricted to a curator (part time), an IT specialist (part time), and a digitiser/database operator, who is assisted in tasks related with ‘Pre-digitisation Curation’ by a herbarium technician.
A previous sampling had been performed in the Iberian Peninsula vascular plants collection (in 11% of the total number of shelves) in order to estimate:
- Total number of specimens (estimated specimen number in November 2016: 66,400 specimens, less than the expected number);
- Rate of total/severe damage to specimens (about 1% of the specimens were totally/severely damaged and 16% of the sampled specimens presented medium to light damage);
- c) average number of specimens by shelf (70 specimens/shelf).
The collection database was catalogued in MsAccess through several projects in different phases/years, to a total of about 75,000 records. Before the migration to a new Herbarium collection management system (Specify), it was assessed the need for revision of specimen data for consistency and correction. This task was performed using Excel and OpenRefine, and implied a 6 PM effort, and did not involve data checking through specimen visualisation, which was left to the digitisation phase. Possible monitoring indicators of this stage can be:
- PM time effort
- Number of operations in OpenRefine
For the image digitisation task, specimens were inspected for cleaning/remounting (if needed), before being taken to the digitisation station. A new numbering system was also devised, which implied adding to each specimen a vinyl sticker with a Barcode (Data Matrix format), as well as the corresponding text line (to ensure human and machine readability), representing the new catalogNumber (e.g. LISIXXXXXX, where X represents a number in the range [0-9]).
Digital imaging of specimens was then carried out, involving:
- Image capture and file renaming (according to the specimen new catalogNumber) of each specimen;
- Locating the specimen record in Specify;
- Checking minimal data correctness or adding a new record (with minimal data) to Specify. Often, an additional verification of the collection locality correctness was also performed, mainly on previously existing location data (since new specimen georeferencing is a high time-consuming, tool and source data demanding job that is better performed as a specific, optimised task at a later moment).
Monitoring of digitisation rates was performed informally, by registering day-by-day imaging rates on a spreadsheet. Log data in Specify database (e.g. create or update timestamps) are an option, but in a limited way, because record creation date relates to the date of data imports to Specify, and update date can vary if record is edited multiple times or by multiple database users.
The numbers obtained are highly conditioned by a number of factors, which vary dynamically and for person to person. Some of the most significant influencing factors seem to be:
- Digitiser/database operator’s experience level and familiarity with equipment and its setup;
- Up-to-date level of information in the database. Groups of specimens recently reviewed require fewer effort to update data (e.g. taxonomic updates in the database);
- Image station acquisition speed (e.g. flatbed scanners are much slower then planetary scanners);
- Handwritten labels readability, detail level (especially regarding specimen collection location data) and correctness;
- Frequency of ‘new record’ operations, which are more time-consuming then ‘minimal data checking’ operations;
- The need for ‘resting breaks’ from the operator, since the tasks performed demand a high level of concentration, which is hard to maintain over long periods of time.
Over a period of 169 working days (about 8 working months, and considering a 7 hour/day journey) overall figures showed an average of 50 and a median of 48 specimens digitised and database checked, per day. Considering just the imaging tasks, this number can easily rise to about 150 specimens processed by day. The figure below provides a quick view of the spread of rates for the whole period.
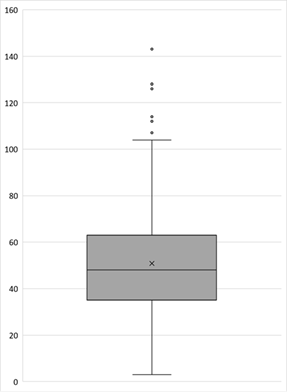
Figure: Box-plot representation of the daily specimen digitisation rates at LISI Herbarium. The x symbol represents the average.
All operations involved in three distinct digitization phases (Pre-digitisation curation - tasks occurring prior to databasing or imaging; Digital Image workflow - scanner setup, image capture, image processing and image archiving; Post-digitisation curation - image quality control and data quality control) are described in detail in the LISI Herbarium Workflow, as well as represented in the diagrams available at the LISI Herbarium workflow on this website.
Monitoring Processes for KPI and Downstream Monitoring
Downstream monitoring refers to the usage of data acquired during digitisation projects. Strictly speaking this is not part of a given digitisation project, but applies to departmental or institutional digitisation objectives. In the following downstream monitoring is referred to as a key performance indicator (KPI). A KPI is a type of performance measurement used to evaluate the success of an institution or organisation. More specifically, it can evaluate the progress and success of certain projects or initiatives the institution is involved in, according to the respective project goals. The success can also be defined as how the institution is making progress towards strategic goals (institutional KPIs).
While data for establishing KPIs can be derived from process and database monitoring, they are usually aggregated for regular reporting on a monthly, quarterly or annual base, not in parallel to the execution phase of digitisation projects.
Common KPIs for promoting the performance of digitisation activities in institutions are:
- Total number of specimen records databased
- Total number of specimen images digitised
- Total number of specimen records and digital assets put on-line
- Percentage of specimens from the collection digitised (requires a good assessment of the total of specimens in the collection)
- Number of running and concluded digitisation projects
- Staff time spent on digitisation projects
- Actual costs for digitisation projects
- Number of thematic science deliverables
Recently, one standard has emerged allowing cross-institutional comparison of digitisation activities that may be used as an indicator: Minimum Information about a Digital Specimen (MIDS). MIDS reports digital objects and can cover the first three of the above-mentioned indicators. As there is still no community standard for counting specimens in natural history collections, MIDS is less suited to provide information on the percentage of specimens digitised across institutions. However, MIDS may be useful at institutional level for providing this kind of relative data.
All monitoring data mentioned so far focusses on digital data acquired from collection objects or processes for data acquisition. From a strategic perspective for institutions, but also for the larger community, it is important to understand, if and how the data from digitisation projects is used. This KPI has also been referred to as ‘downstream monitoring’. So far downstream monitoring is limited to the measurement of downloads from online catalogues or GBIF. With the progress of digitisation in collection holding institutions and the usage of stable identifiers it will be possible in future to better track the usage of collection specimens in research and beyond.
As shown in case study from the Natural History Museum London below, the economic benefit of digitally available collection objects from Natural History Institutions is huge. It will be a task for the DiSSCo community to develop the right tools and processes for measuring this impact through digitisation monitoring.
Natural History Museum London: Institutional KPIs
Click here to expand
The NHM has an annual Operating Plan that underpins our vision and strategy. This includes ‘Page zero’ targets which are a short set of targets measuring the key aspects of our business. Two page zero targets monitor digitisation, both related to the strategic goal of ‘securing the future of our collection’. One focuses on digital discoverability of collections, measured by the number of new specimen records added to our data portal each quarter (the majority - but not all - of which are added by our central digitisation team), and is expressed as an annual and quarterly target. It is recognised that this target cannot be the only driver for digitisation, however - new records are balanced with other projects that enhance records or offer innovation benefits. The other relevant page zero measure focuses on access to collections and includes download events for our data from our data portal and GBIF - this is not expressed as a target as we do not directly control it, but as a ‘minimum’ level based on previous averages. This is monitored quarterly and if download events fell below the minimum set further work would be undertaken to understand why and to correct this.
In addition to the page zero metrics, the Museum’s strategic objective to ‘transform the study of natural history’ also has a number of thematic science deliverables for the year in the Operating Plan, including for the Data, Digital and Informatics team and theme. These are where we balance the page zero new records target by covering the need to deliver a wider balanced portfolio of digitisation work. This is also where we record other key aspects of work for example in relation to EU and UK projects at a high level. Typically these deliverables are time bound and we report quarterly against them but they are not expressed as quantified targets more as milestones to be reached by certain dates.
Royal Botanic Garden Edinburgh: Institutional KPIs
Click here to expand
The Royal Botanic Garden (RBGE) has an annual Operational Delivery Plan (ODP) which prioritises and organises the work required to deliver the RBGE Strategy. The ODP contains deliverables for departments across the organisation, with a set of KPIs to monitor progress.
For the Herbarium collections, the following KPIs are monitored:
- Number of downloads from RBGE online catalogue
- Total Herbarium specimen records databased
- Total % of Herbarium specimen records databased
- Total Herbarium specimen images digitised and put on-line
- Total accessions recorded in the Silica-dried Collection
Each KPI has an annual target, with monthly, quarterly and annual reporting. The figures are calculated using scripts to query a set of databases: the Herbarium specimens database (Specify), the image database (In-house), the downloads database (In-house) and the silica-dried collections database (In-house).
Museum für Naturkunde Berlin: Metadata Monitoring
Click here to expand
Successful monitoring processes require clear objectives. Performance indicators can be collected regularly, but they only become interesting as a steering mechanism when they allow conclusions to be drawn about whether goals can be achieved. Digitisation rates mainly depend on the depth of information acquired during the process and are usually restricted by the availability of staff and the technological setup. For example, the acquisition of three images will require more time than just one and a high-resolution multi-focus image requires a more complex workflow than a standard definition overview image. However, not only the number and resolution of images should be defined at the beginning of each digitisation project. It is equally important to agree on which metadata can and should be acquired.
For this purpose Museum für Naturkunde (MfN) developed the framework “Minimum Extent of Information and Purpose Oriented Specimen Description” (MIPOD). As a collaborative effort with collection managers and heads of collections, all information relevant for the management and publication of object-related collection data was collected across the collection, independently of the collection management system used. In addition, lists of controlled vocabularies and links to existing external references were also taken into account where appropriate. In a bottom-up process a minimum level of information has been defined for all objects across geological, paleontological, zoological collections as well as the library and archive. The minimum data to be acquired for each object are defined by a unique identifier, a title (e.g. taxonomic name), an object type name (e.g. PreservedSpecimen, based on ABCD RecordBasis), a collection name, the institution name and the type status (is it a type specimen or not, if applicable).
In the context of digitisation monitoring the MIPOD framework allows to define targeted metadata in a transparent and consistent way. At the beginning of each project all stakeholders can agree on a set of metadata that must be acquired. There is no limitation as to the size of the defined subset, but it means that additional data will not be acquired during that digitisation process. This allows us to manage expectations and to better control the digitisation time spent on each object. Further it enables us to monitor the completeness and thus the quality of the process.
Natural History Museum London: Economic Benefits
Click here to expand
Like many collections, the Natural History Museum (NHM) has often relied on case studies to make the case for the impact of digitisation, alongside statistics about records downloaded, download events and citations (via GBIF).
In 2021, the Museum worked with Frontier Economics to build on this by developing estimates of the economic benefit of digitised collections. This report (Popov et al., 2021) identified benefits of some £2bn over 30 years, a seven- to ten- times return on investment. Three methodologies were used to understand the economic benefits; two looking at the range of return on investment in scientific research from the literature, and applying this either to an investment figure or to an estimate of reinvested research efficiencies from digitised data (based on physical visit costs and numbers of digital download events). Most importantly, the report examined five pathways to value based on particular economic sectors or activities, estimating the value of these activities and the difference that access to digitised collections data could make. The areas examined were invasive species; agricultural research & development; medicines discovery; biodiversity conservation and mineral exploration, each showing a clear benefit through digitisation.
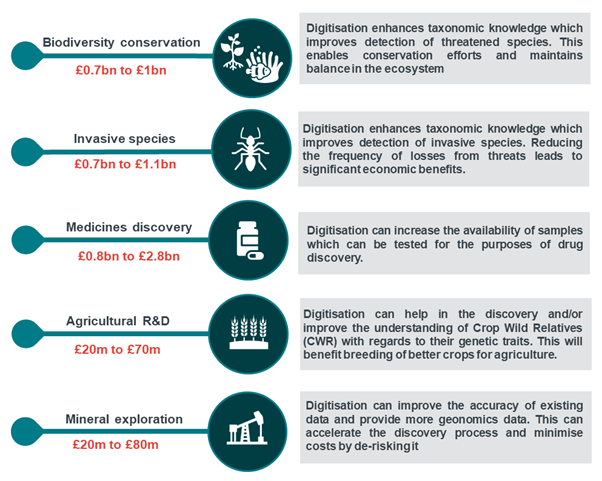
Figure: Five Pathways to Value from Digitisation
This report has been a valuable new way to discuss investment in digitisation with government or other potential funders. The NHM also hope to build on this with additional future research e.g. more detailed understanding of the users and uses of digitised specimen data, to continue developing the case.
Authors
Frederik Berger & Sabine von Mering - Museum für Naturkunde
Laurence Livermore, Lisa French, Helen Hardy & Peter Wing - Natural History Museum London
Elspeth Haston - Royal Botanic Garden Edinburgh
Pedro Arsénio & Rui Figueira - Universidade de Lisboa
References
Popov D, Roychoudhury P, Hardy H, Livermore L, Norris K (2021) The Value of Digitising Natural History Collections. Research Ideas and Outcomes 7: e78844. https://doi.org/10.3897/rio.7.e78844
Licence
CC-BY
Document Control
Version: 1.0
Changes since last version: N/A
Last Updated: 17 August 2022
Edit This Page
You can suggest changes to this page on our GitHub